Welcome to our Navellier Graders
Click on the grader you wish to use.
Stock Grader
What do the grades mean?
Our Stock Grader utilizes key fundamental metrics and weights them in an average to determine a grade of A to F. “A” being our highest ranking persistence model which, as a group, tends to outperform the low persistence stocks, as well as the market in general. The final grade a stock receives (“Total Stock Grade”) is based on its Navellier Proprietary Quantitative Grade and its Overall Fundamental Grade. Only those stocks that received both a top Quantitative Grade and a top Overall Fundamental Grade receive an “A”.
Why Stocks?
Stocks can provide some of the safest earning potential in this volatile market.
How often is the data updated?
The stock data is updated weekly.
Navellier Stock Grader Growth of $100 Example
Net February 1, 1998 to December 31, 2023
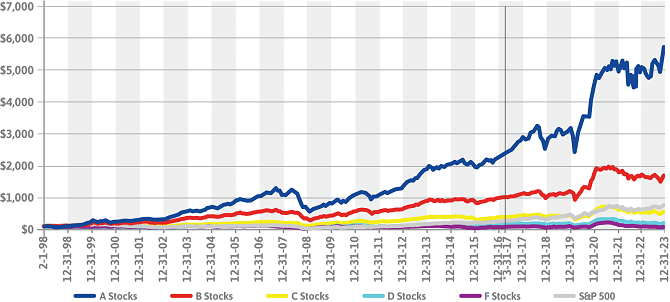
(*Updated and corrected 3-31-17 through present.)
The chart above reflects the theoretical historical total return of stocks assigned a letter rank of A, B, C, D and F using a combination of the proprietary Navellier Stock Grader Fundamental grade and Navellier Stock Grader Quantitative grade. It is not intended to be, and is not personalized investment advice or an investment strategy. It is solely a compilation from Navellier’ research and analytics. For grading individual stocks hypothetical performance results presented herein do not indicate future performance. The performance results portrayed include the hypothetical reinvestment of all dividends and other earnings. Net results of all dividend and earnings for all stocks also include our estimation of hypothetical investment advisory fees, administrative fees, transaction expenses, or other expenses that a client would have paid. A 1.75% annualized advisory fee is built into the net return calculations although that fee is likely higher than any actual advisory fee invested in stocks involves substantial risk and has the potential for partial or complete loss of funds invested. Graphs are for illustrative purposes only. This graph is not to be construed as an offer to buy or sell any financial instrument or investment advice and should not be relied upon as a factor in an investment making decision. (Note, is not investment advice, these are model results, no actual money was invested. Please see further important disclosures at the end of this document.)
Stock Grades are subject to change. The sample portfolio is an example and should not be used to make investment decisions. Navellier may hold some or all of these securities in some or all of its investment portfolios. The sample portfolio and accompanying charts are for informational purposes only and are not to be construed as an offer to buy or sell any financial instrument and should not be relied upon as the sole factor in an investment making decision. Investment in securities involves significant risk and has the potential for partial or complete loss of funds invested. As with all investments, there are associated inherent risks. Please obtain and review all financial material carefully before investing. The above portfolio is theoretical and is not an actual funded or traded portfolio. See important disclosures at the end of this document.
Try out our Stock Grader (returning users also) – Click Here
ETF Grader
What do the grades mean?
The Navellier ETF grades are based on return/risk characteristics, of each individual ETF, ranked relative to its best fitting (highest R2) broad based Index. Each week we compile and calculate statistics, Alpha, Beta, Standard Deviation, R-Squared for a list of over 1500 ETFs. Using the respective 60 or 90 day cycle we calculate how an ETF has performed on a risk adjusted basis relative to its best fit broad market index.
The final grade for each ETF is based on its risk adjusted performance relative to the Russell 3000 index constituents. An "A" Grade is assigned to ETFs that exhibit positive return/risk characteristics over the given cycle and an "F" Grade represents ETFs that have exhibited lesser/negative return/risk characteristics. These rankings can/will change weekly depending on market conditions and volatility.
Why ETFs?
Exchange traded funds are generally structured to hold a basket of securities and usually offer investors the ability to not only buy and hold an ETF position but also trade in and out of a position intra-day.
How often is the data updated?
The ETF data is updated weekly.
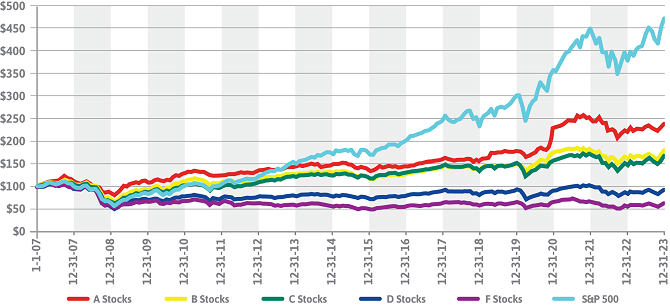
Navellier ETF Grader Growth of $100 Example
Net January 1, to December 31, 2023
Net March 1, 2006 to December 31, 2023
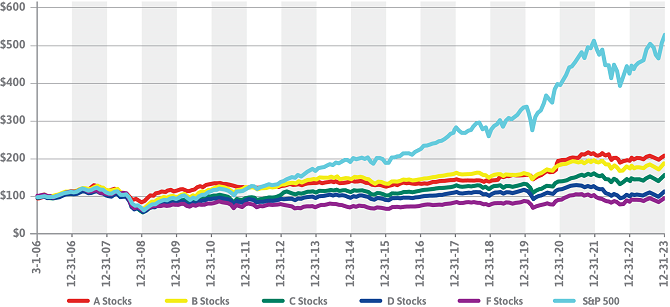
The chart above reflects the theoretical historical total return of stocks assigned a score of A, B, C, D, or F using key fundamental metrics. Performance results presented herein do not necessarily indicate future performance. Results presented include the reinvestment of all dividends and other earnings. Investment in equity strategies involves substantial risk and has the potential for partial or complete loss of funds invested. Graphs are for illustrative and discussion purposes only. This graph is not to be construed as an offer to buy or sell any financial instrument and should not be relied upon as the sole factor in an investment making decision. (Note, these are model results, no actual money was invested. Please see important disclosures below.)
Try out our new ETF Grader (returning users also) – Click Here
Dividend Grader
What do the grades mean?
Our NEW Dividend Grader utilizes key fundamental metrics and weights them in an average to determine a grade of A to F. A being our highest ranking dividend persistence model which, as a group, tends to outperform the low persistence stocks, as well as the market in general. This grading system replaces the previous system where stocks were graded on a scale of 1 to 3.
Why Dividends?
Dividends can provide some of the safest earning potential in this volatile market.
How often is the data updated?
The dividend data is updated weekly.
Navellier Dividend Grader Growth of $100 Example
Net January 1, 2003 to December 31, 2023
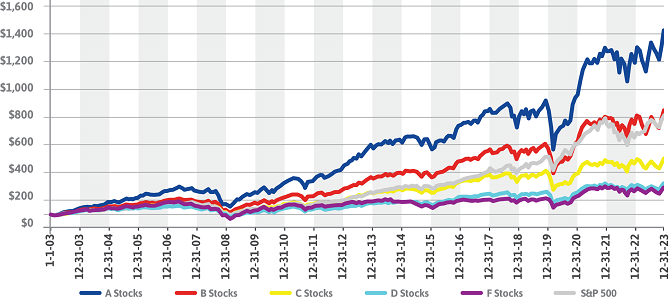
The chart above reflects the theoretical historical total return of those stocks assigned a grade of either A, B, C, D or F using Navellier’s model of key fundamental metrics for grading individualized stocks. It is not intended to be, and is not personalized investment advice or an investment strategy. It is solely a compilation from Navellier’ research and analytics. For grading individual stocks hypothetical performance results presented herein do not indicate future performance. The performance results portrayed include the hypothetical reinvestment of all dividends and other earnings. Net results of all dividend and earnings for all stocks also include our estimation of hypothetical investment advisory fees, administrative fees, transaction expenses, or other expenses that a client would have paid. A 1.75% annualized advisory fee is built into the net return calculations although that fee is likely higher than any actual advisory fee invested in stocks involves substantial risk and has the potential for partial or complete loss of funds invested. Graphs are for illustrative purposes only. This graph is not to be construed as an offer to buy or sell any financial instrument or investment advice and should not be relied upon as a factor in an investment making decision. (Note, is not investment advice, these are model results, no actual money was invested. Please see further important disclosures at the end of this document.)
Dividend Grades are subject to change. The sample graphs are examples and should not be used to make investment decisions. Navellier may hold some or all of these securities in some or all of its investment portfolios. The sample stocks and accompanying charts are for informational purposes only and are not to be construed as an offer to buy or sell any financial instrument or investment advisory services and should not be relied upon as a factor in an investment making decision. Investment in securities involves significant risk and has the potential for partial or complete loss of funds invested. As with all investments, there are associated inherent risks. The above graphs are theoretical and are not actual funded or traded portfolios. See important disclosures at the end of this document.
Try out our new Dividend Grader (returning users also) – Click Here
Investment in stocks involves substantial risk and has the potential for partial or complete loss of funds invested. The accompanying charts are for informational purposes only and are not to be construed as an offer to buy or sell any financial instrument or investment strategy and should not be relied upon in an investment making decision. This is not an offer of investment advice and is not an investment strategy. It is simply a disclosure of the results of Navellier’s proprietary analysis. The performance presented is not based on any actual securities trading, portfolio, or accounts, and the reported hypothetical performance of the A, B, C, D, and F stock groups graded should not be considered investment advice or an investment strategy.
The charts and other information presented here do not represent actual funded trades and are not actual funded portfolios. There are material differences between hypothetical and the research, and hypothetical performance figures presented here. The research results (1) may contain stocks that are illiquid and difficult to trade; (2) may contain stock holdings materially different from actual funded investments; (3) include the reinvestment of all dividends and other earnings, estimated trading costs, commissions, or management fees; and, (4) may not reflect prices obtained in an actual funded investment. For these and other reasons, the reported performances do not reflect the performance results of actually funded and traded Investment Products.
As a matter of important disclosure regarding the hypothetical results presented for Stock Grader and Dividend Grader, the following factors must be considered when evaluating the long- and short-term performance figures presented:
(1) Historical or illustrated results presented herein do not indicate future performance; Investment in securities involves significant risk and has the potential for partial or complete loss of funds invested.
(2) The results presented were generated during a period of mixed (improving and deteriorating) economic conditions in the U.S. and positive and negative market performance. There can be no assurance that these same market conditions will occur again in the future. Navellier has no data regarding actual performance in different economic or market cycles or conditions.
(3) The back-tested historical look back performance was derived from the hypothetical application of a particular Navellier analysis applying investment criteria with the benefit of hindsight.
(4) The hypothetical results portrayed reflect the hypothetical reinvestment of dividends and other income.
(5) The hypothetical net performance results portrayed include the hypothetical reinvestment of all dividends and other earnings. Hypothetical net results also include our estimation of investment advisory fees, administrative fees, transaction expenses, or other expenses that an investor might have paid. A 1.75% annualized advisory fee is built into the net return calculations although that fee is higher than actual advisory fees investors normally pay for investment advisory services.
(6) LIMITATIONS INHERENT IN HYPOTHETICAL RESULTS: The hypothetical performance results presented are not from actually funded investments, and may not reflect the impact that material economic and market factors might have had on adviser’s or investors decision making if an adviser were actually managing a clients’ money, and thus present returns which are greater than what an actual investor would have experienced for the time period. The results are presented for informational purposes only. No real money has been invested in this analysis of hypothetical performance. The hypothetical performance results should not be considered and are not actual performance.